find_trapped_regions
This is meant to find regions of defending phase that are trapped during an invasion simulation. It works for both ordinary and invasion percolation type simulations.
import matplotlib.pyplot as plt
import numpy as np
import porespy as ps
ps.visualization.set_mpl_style()
[19:52:50] ERROR    PARDISO solver not installed, run `pip install pypardiso`. Otherwise,          _workspace.py:56
                    simulations will be slow. Apple M chips not supported.
No module named 'pyedt'
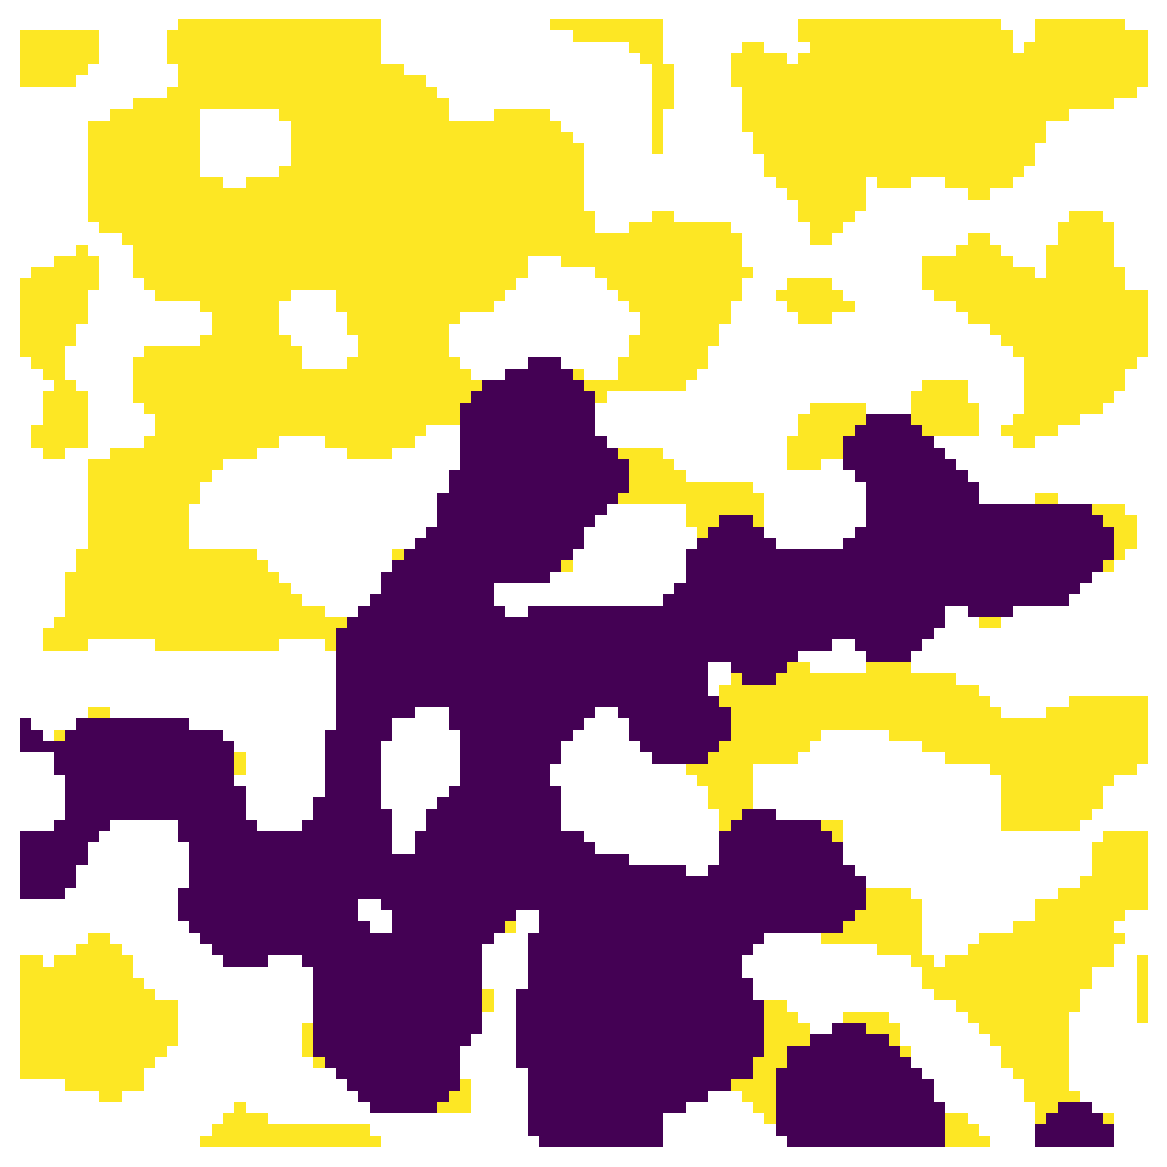
im = ps.generators.blobs(shape=[100, 100], porosity=0.6, seed=7)
inlets = np.zeros_like(im)
inlets[0, :] = True
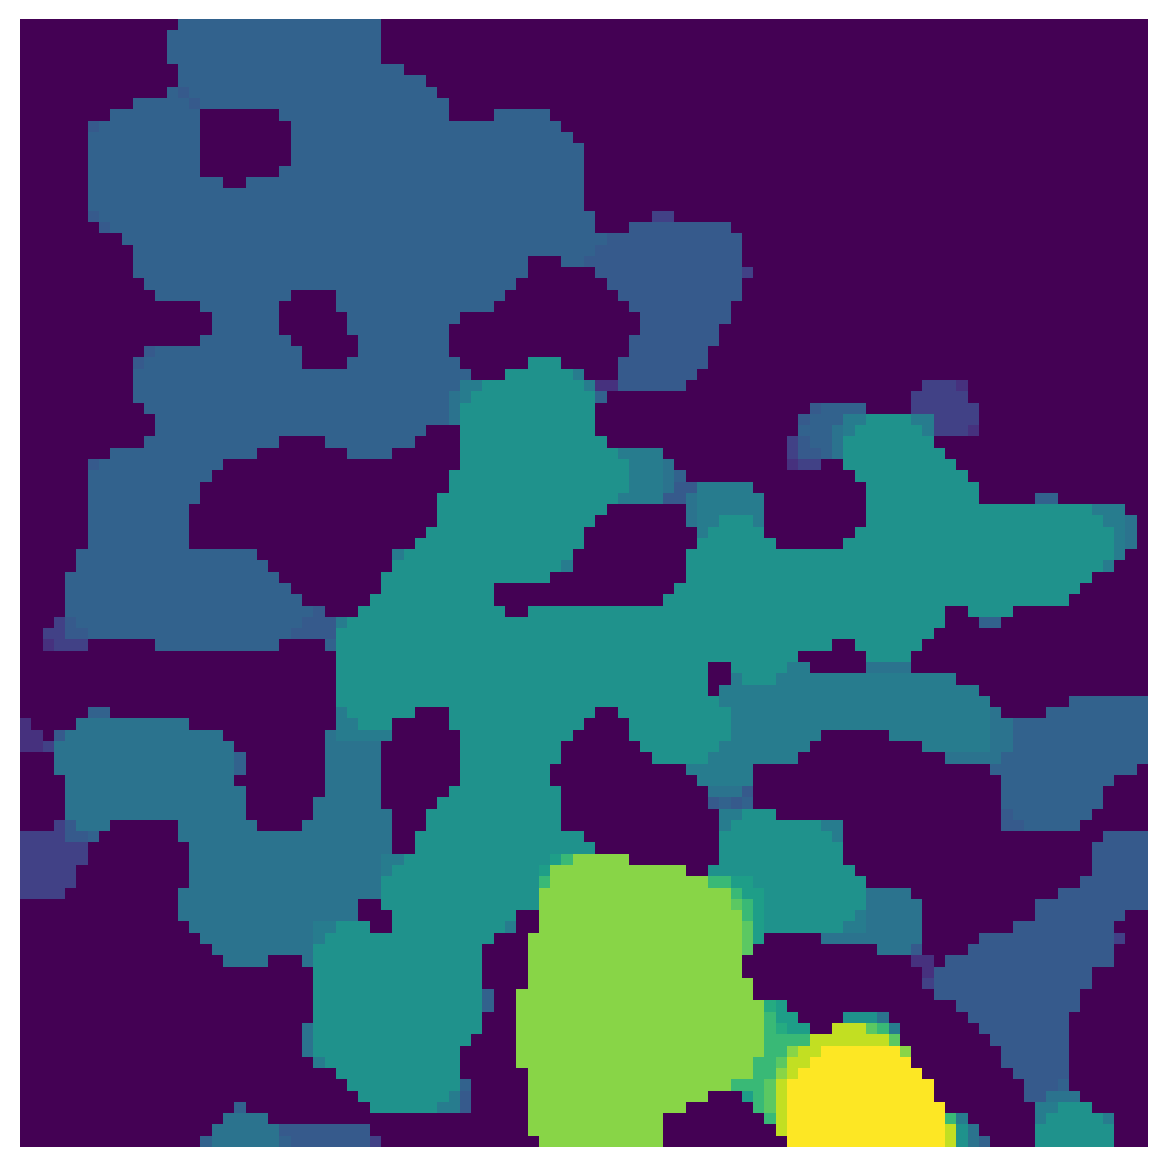
sizes = ps.filters.porosimetry(im, inlets=inlets)
fig, ax = plt.subplots(1, 1, figsize=[6, 6])
ax.imshow(sizes, interpolation='none', origin='lower')
ax.axis(False);
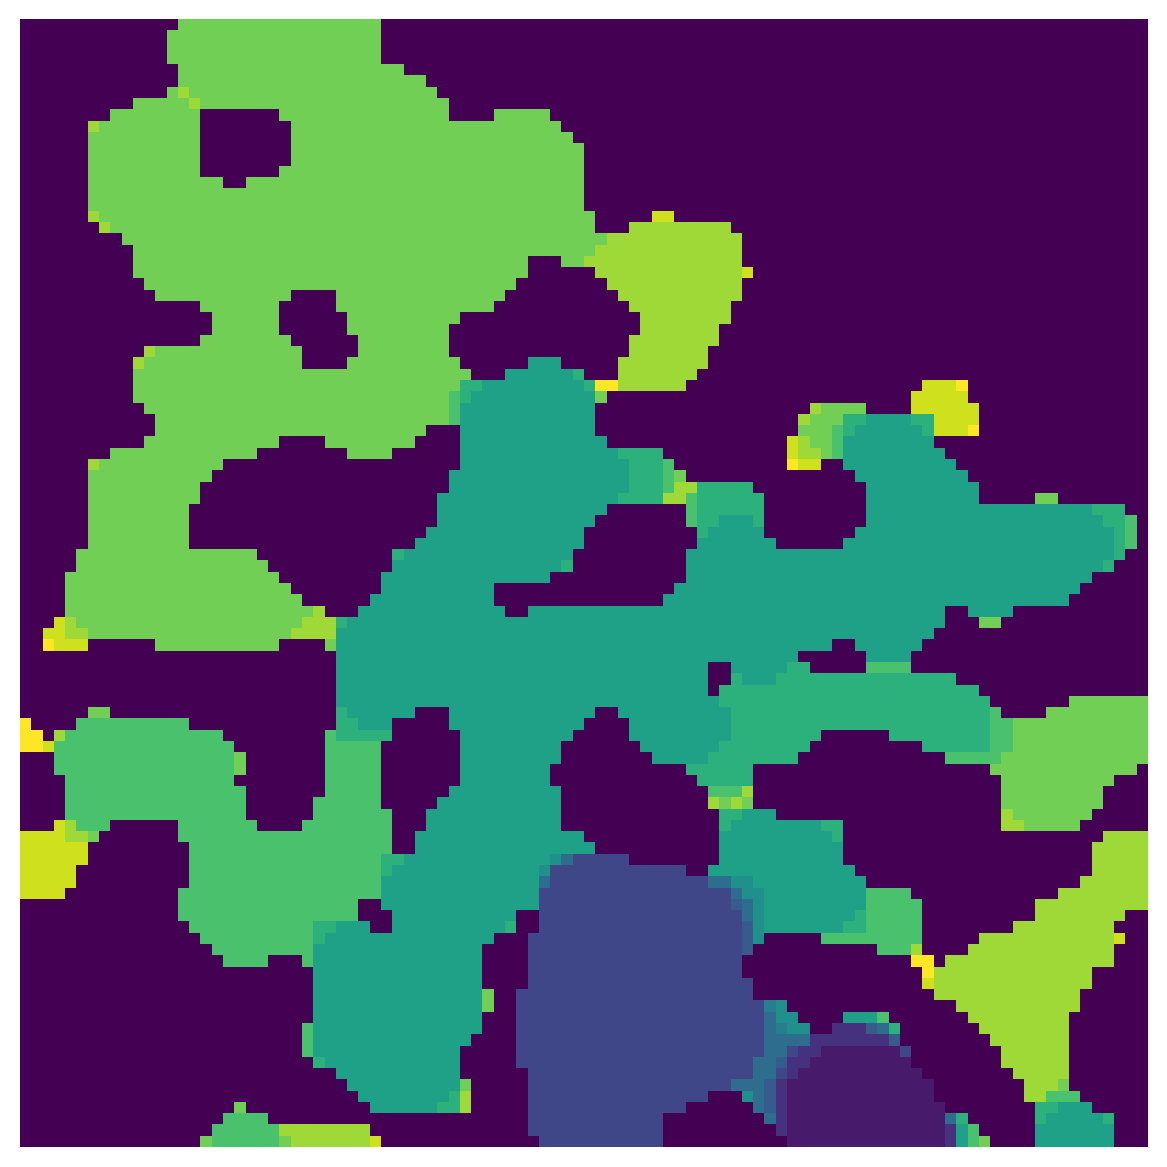
seq
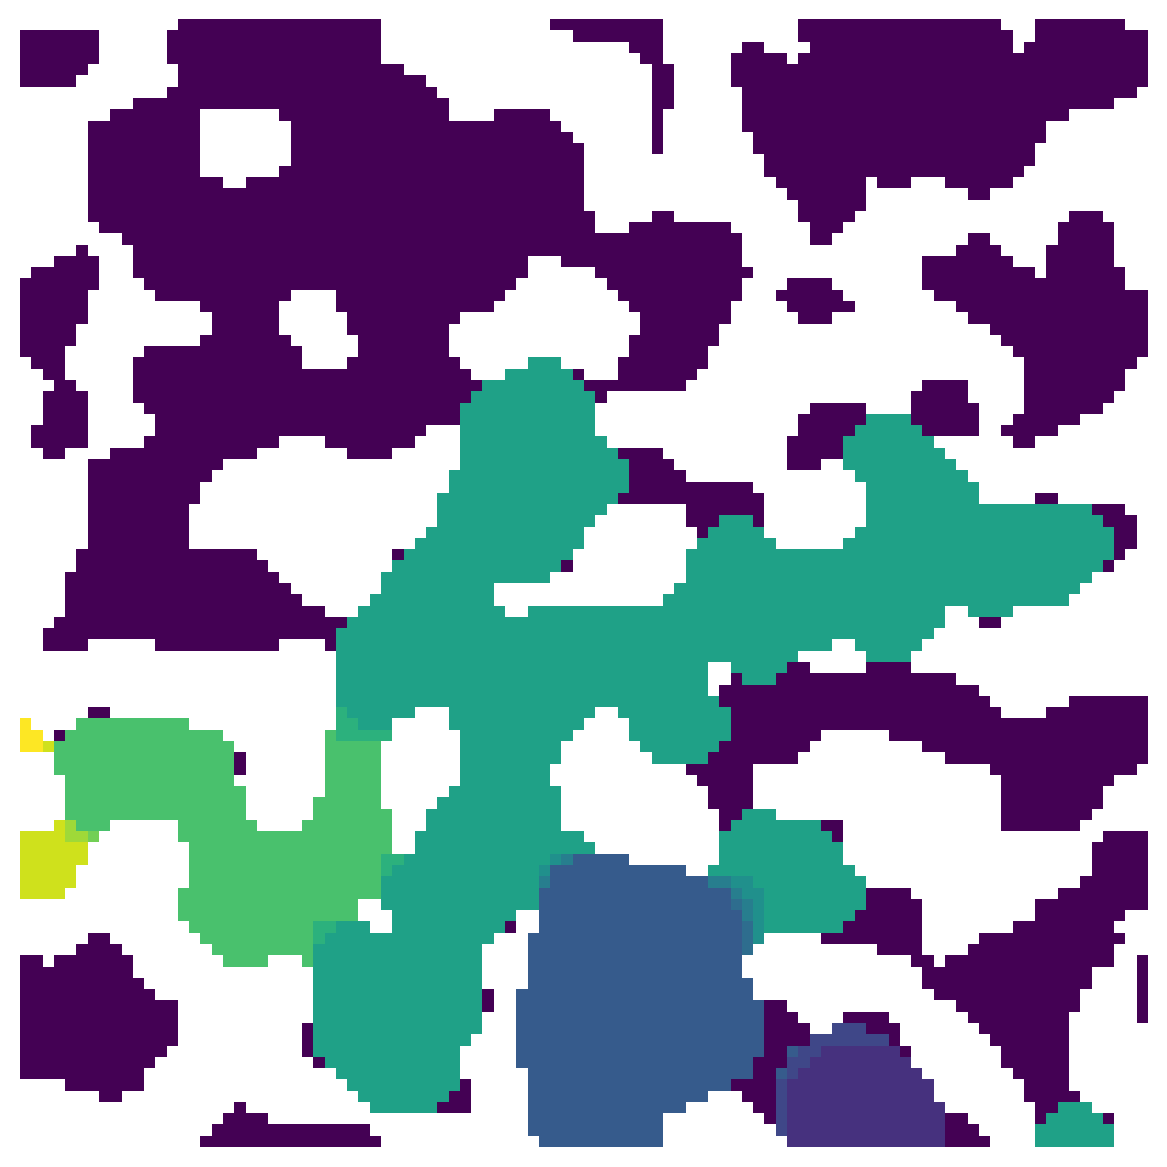
Given the sequence at which each voxel was invaded, this finds all voxels that were invaded after they were cutoff from the outlet. The output of porosimetry however is in the reverse order, since the largest sizes are invaded first. PoreSpy has a function for this, called size_to_seq:
seq = ps.filters.size_to_seq(sizes)
fig, ax = plt.subplots(1, 1, figsize=[6, 6])
ax.imshow(seq, interpolation='none', origin='lower')
ax.axis(False);
Now we can pass this result into find_trapped_regions:
outlets = np.zeros_like(im)
outlets[-1, :] = True
trapped = ps.filters.find_trapped_regions(im=im, seq=seq, outlets=outlets)
fig, ax = plt.subplots(1, 1, figsize=[6, 6])
ax.imshow(trapped/im, interpolation='none', origin='lower')
ax.axis(False);
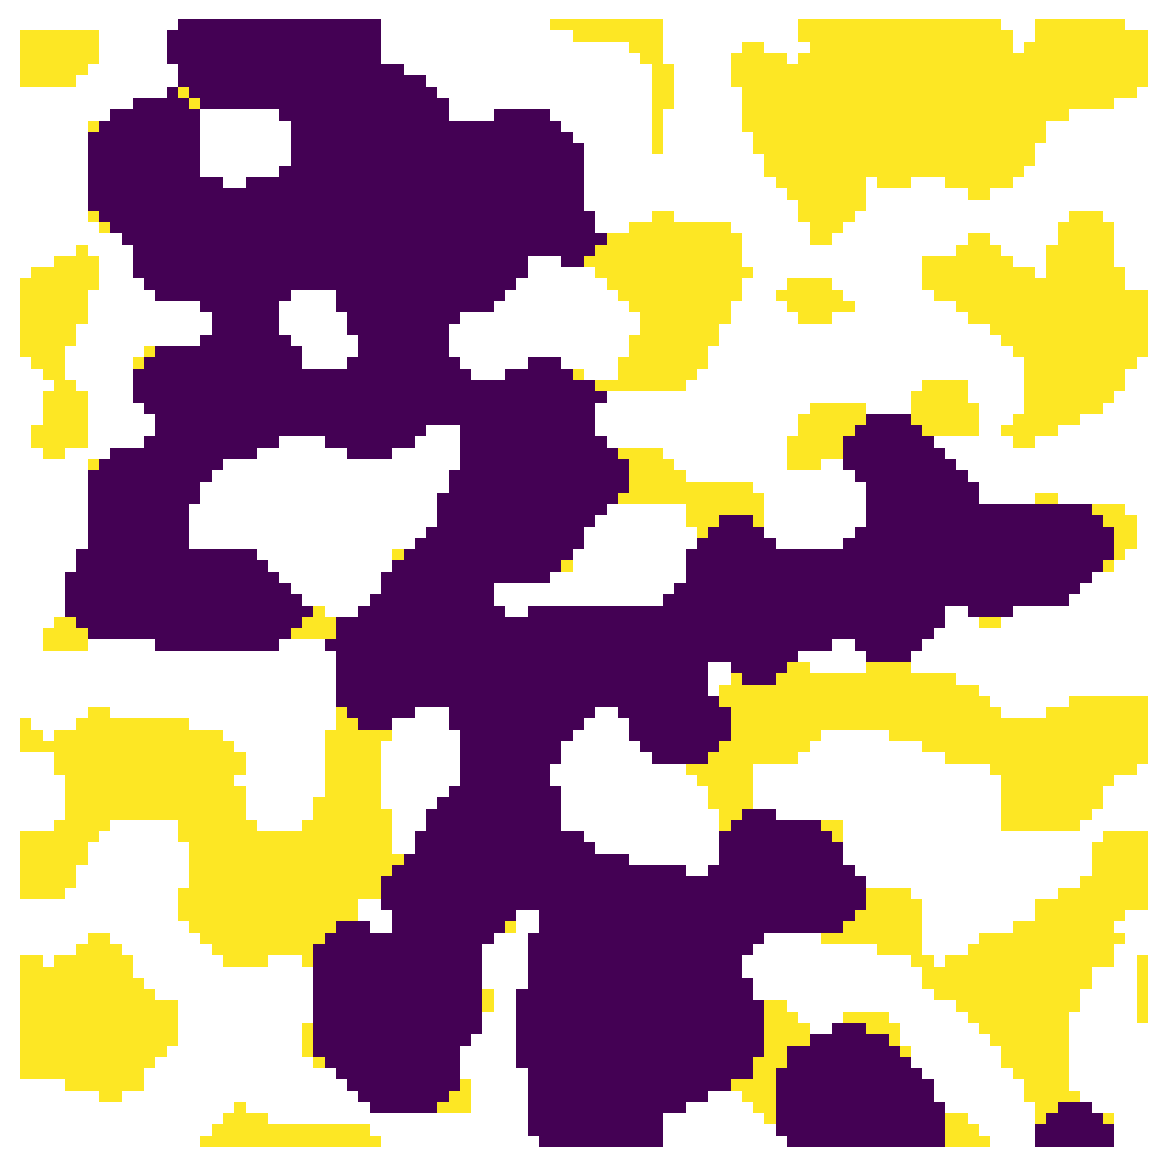
In the above image the trapped regions are indicated by True, so this can be used as a mask to remove invading voxels from the invasion image.
outlets
It’s possible to specify the which voxels are treated as the outlets. If the outlets were on the right we’d see the following:
outlets = np.zeros_like(im)
outlets[:, 0] = True
trapped = ps.filters.find_trapped_regions(im=im, seq=seq, outlets=outlets)
fig, ax = plt.subplots(1, 1, figsize=[6, 6])
ax.imshow(trapped/im, interpolation='none', origin='lower')
ax.axis(False);
return_mask
By default the function will return as boolean mask with trapped regions indicated as True. However, if this is set to False, then seq is returned with trapped voxels set to -1 and the other sequence values updated accordingly.
seq2 = ps.filters.find_trapped_regions(im=im, seq=seq, outlets=outlets, return_mask=False)
fig, ax = plt.subplots(1, 1, figsize=[6, 6])
ax.imshow(seq2/im, interpolation='none', origin='lower')
ax.axis(False);
method
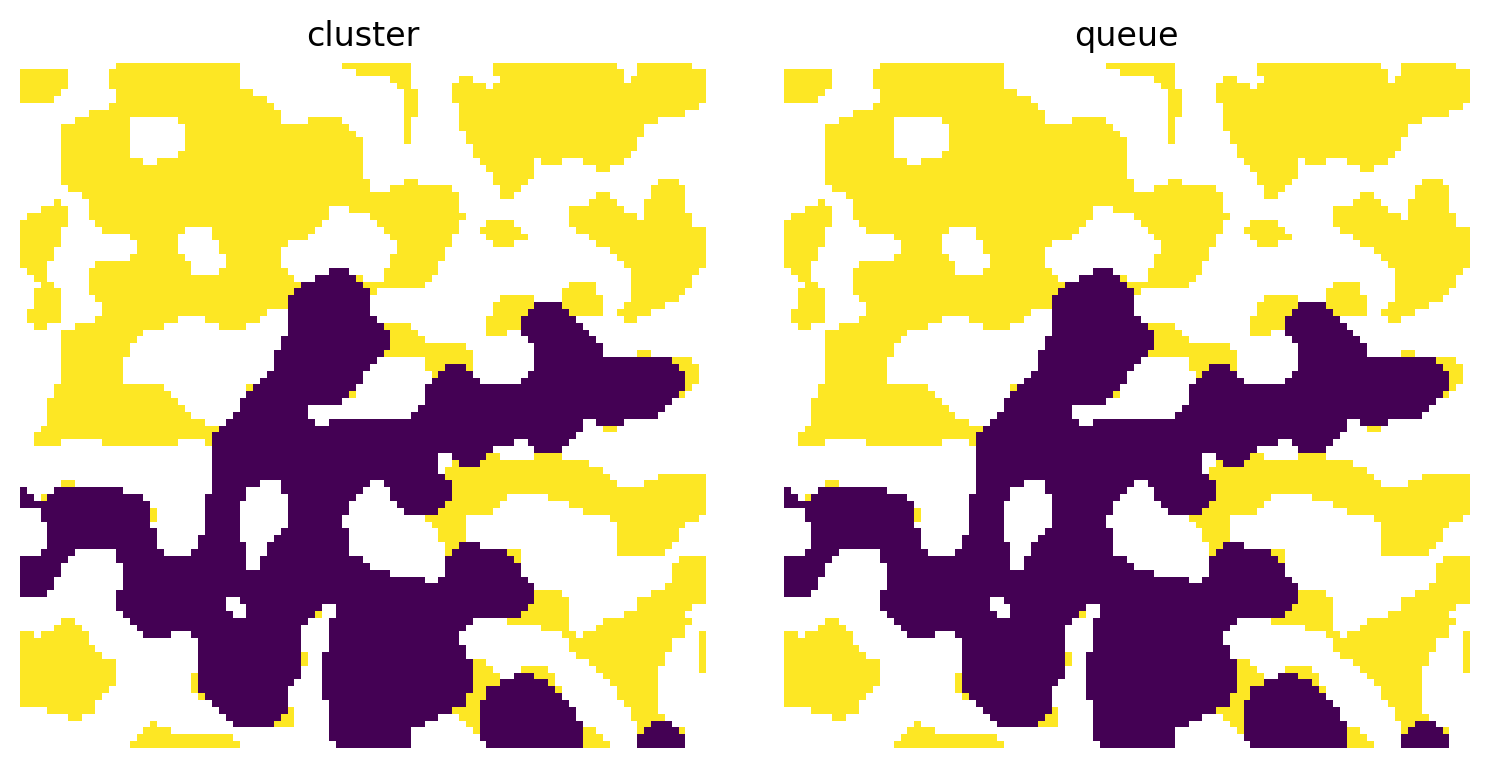
There are two options for this argument: 'cluster' and 'queue'. The former is best used for invasion sequences which were produced via ibop algorithms, while the latter is necessary for output from ibip or qbip.
trapped1 = ps.filters.find_trapped_regions(im=im, seq=seq, outlets=outlets, method='cluster')
trapped2 = ps.filters.find_trapped_regions(im=im, seq=seq, outlets=outlets, method='queue')
fig, ax = plt.subplots(1, 2, figsize=[8, 4])
ax[0].imshow(trapped1/im, interpolation='none', origin='lower')
ax[0].axis(False)
ax[0].set_title('cluster')
ax[1].imshow(trapped2/im, interpolation='none', origin='lower')
ax[1].axis(False)
ax[1].set_title('queue');
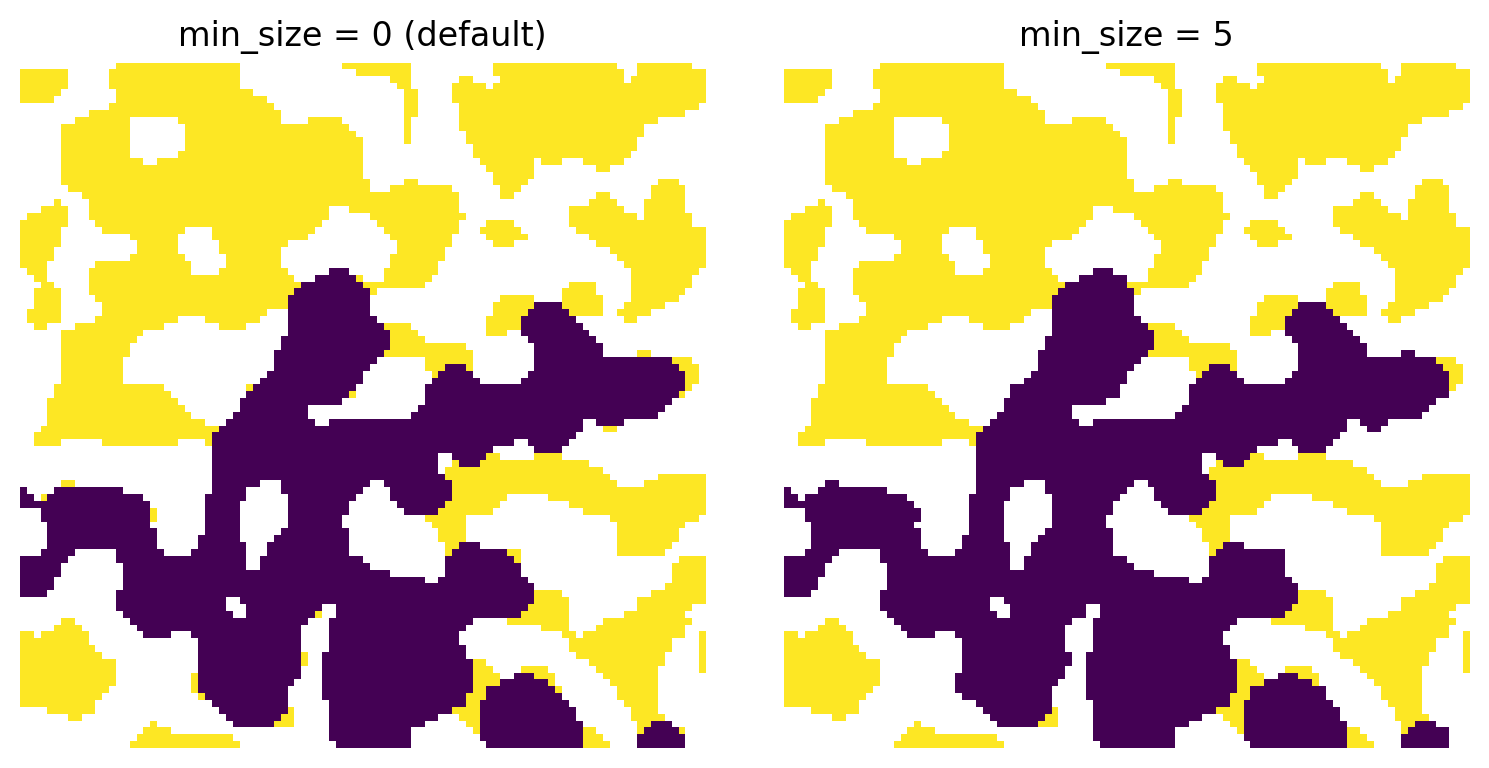
min_size
Due to the digitized nature of the voxel images, there are occasionally/often artifacts. In the case of trapped defending phase this appears as single or small clusters of voxels along the solid walls which lost connectivity during invasion so are technically “trapped”, but in reality these would be able to escape. It is possible to exclude these small voxels be setting the min_size for clusters of voxels, below which they would not be trapped.
trapped1 = ps.filters.find_trapped_regions(
    im=im, seq=seq, outlets=outlets, min_size=0)
trapped2 = ps.filters.find_trapped_regions(
    im=im, seq=seq, outlets=outlets, min_size=5)
fig, ax = plt.subplots(1, 2, figsize=[8, 4])
ax[0].imshow(trapped1/im, interpolation='none', origin='lower')
ax[0].axis(False)
ax[0].set_title('min_size = 0 (default)')
ax[1].imshow(trapped2/im, interpolation='none', origin='lower')
ax[1].axis(False)
ax[1].set_title('min_size = 5');