get_border
Import packages
import matplotlib.pyplot as plt
import numpy as np
import porespy as ps
import scipy.ndimage as spim
import skimage

ps.visualization.set_mpl_style()
[19:54:06] ERROR    PARDISO solver not installed, run `pip install pypardiso`. Otherwise,          _workspace.py:56
                    simulations will be slow. Apple M chips not supported.
No module named 'pyedt'
Generate image for testing
im2d = np.random.rand(60, 60)
im3d = np.random.rand(60, 60, 60)
Demonstrate function
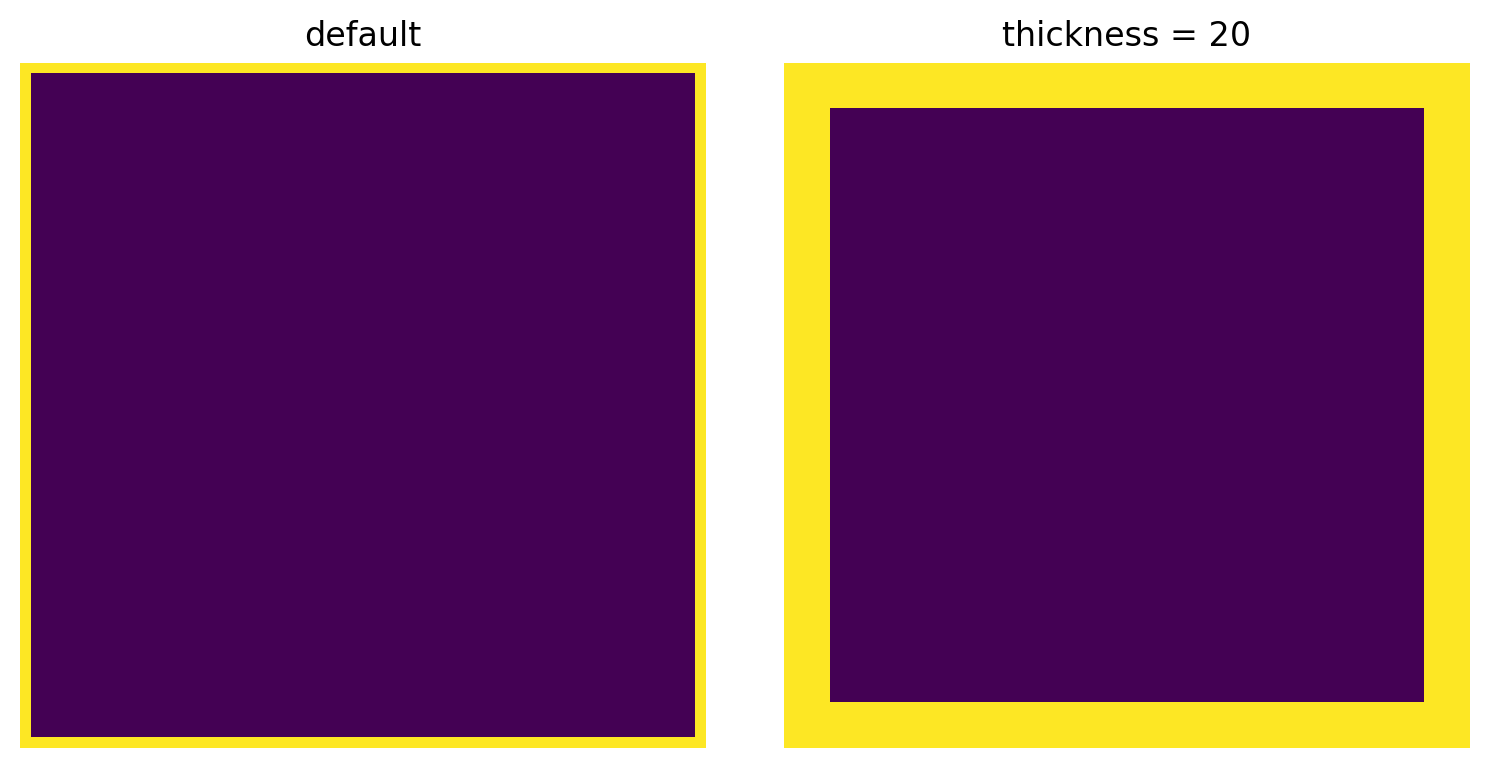
thickness
im1 = ps.tools.get_border(shape=im2d.shape)
im2 = ps.tools.get_border(shape=im2d.shape, thickness=4, mode='edges',)

fig, ax = plt.subplots(1, 2, figsize=[8, 4])
ax[0].axis(False)
ax[0].imshow(im1)
ax[0].set_title('default')
ax[1].axis(False)
ax[1].imshow(im2)
ax[1].set_title('thickness = 20');
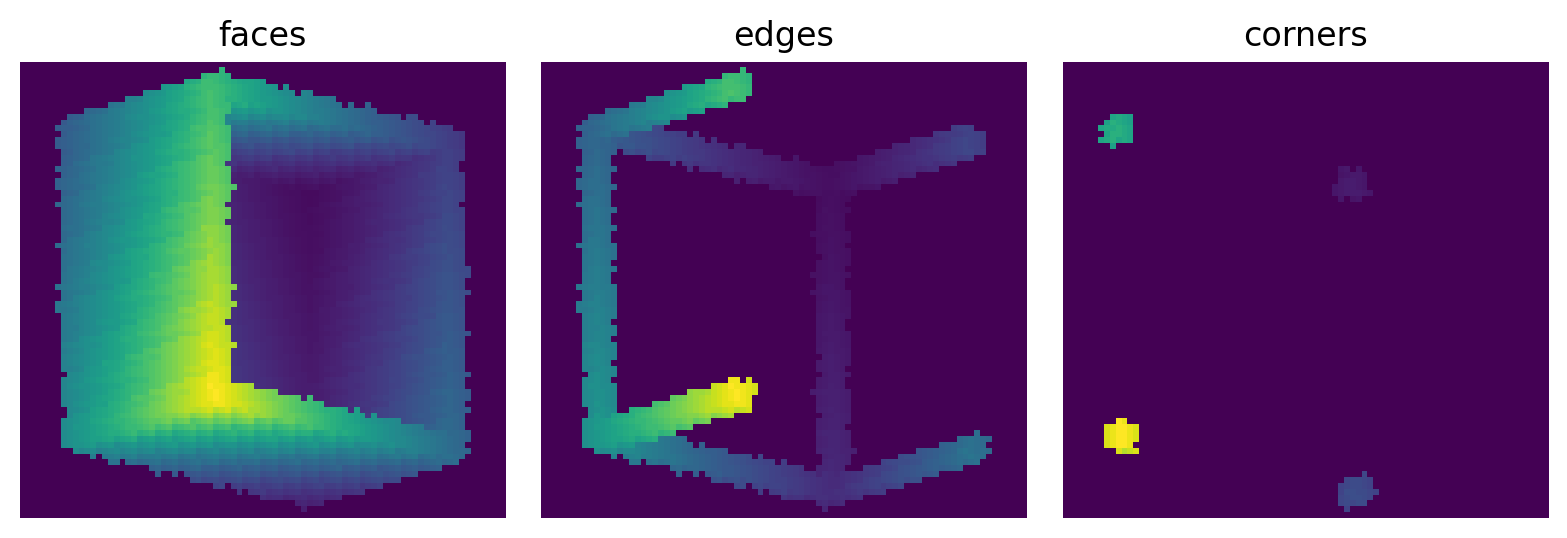
mode
The options are ‘faces’, ‘edges’, and ‘corners’.
im1 = ps.tools.get_border(shape=im3d.shape, thickness=5, mode='faces')
im2 = ps.tools.get_border(shape=im3d.shape, thickness=5, mode='edges')
im3 = ps.tools.get_border(shape=im3d.shape, thickness=5, mode='corners')
The visualization below using the show_3D function which gives a very rough idea of how things look in 3D. It rotates the image using scipy.ndimage.rotate, then does a projection along the z-axis. The results are a bit fuzzy do to the interpolation when rotating, but you can see how the borders look:
fig, ax = plt.subplots(1, 3, figsize=[8, 4])
ax[0].imshow(ps.visualization.show_3D(~im1[..., 20:]))
ax[0].axis(False)
ax[0].set_title('faces')
ax[1].imshow(ps.visualization.show_3D(~im2[..., 20:]))
ax[1].axis(False)
ax[1].set_title('edges')
ax[2].imshow(ps.visualization.show_3D(~im3[..., 20:]))
ax[2].axis(False)
ax[2].set_title('corners');
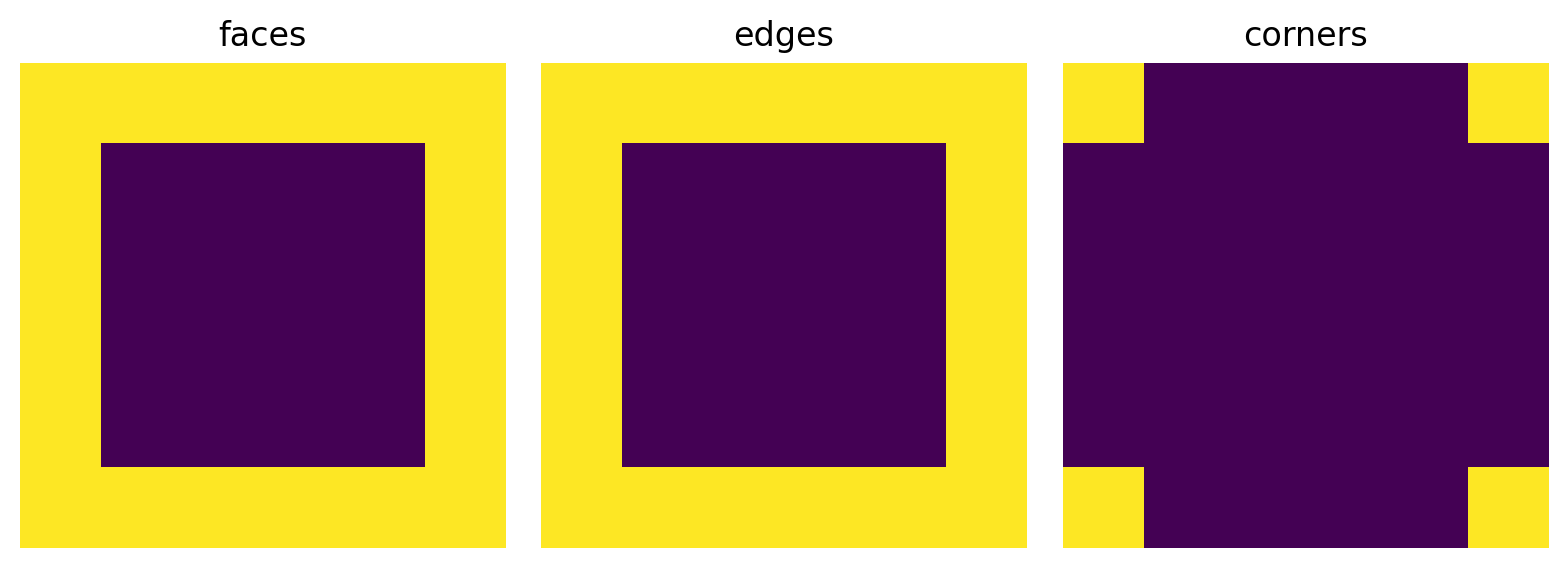
For 2D images, the mode of ‘faces’ and ‘edges’ both return the same thing.
im1 = ps.tools.get_border(shape=im2d.shape, thickness=10, mode='faces')
im2 = ps.tools.get_border(shape=im2d.shape, thickness=10, mode='edges')
im3 = ps.tools.get_border(shape=im2d.shape, thickness=10, mode='corners')
fig, ax = plt.subplots(1, 3, figsize=[8, 4])
ax[0].axis(False)
ax[0].imshow(im1)
ax[0].set_title('faces')
ax[1].axis(False)
ax[1].imshow(im2)
ax[1].set_title('edges')
ax[2].axis(False)
ax[2].imshow(im3)
ax[2].set_title('corners');
return_indices
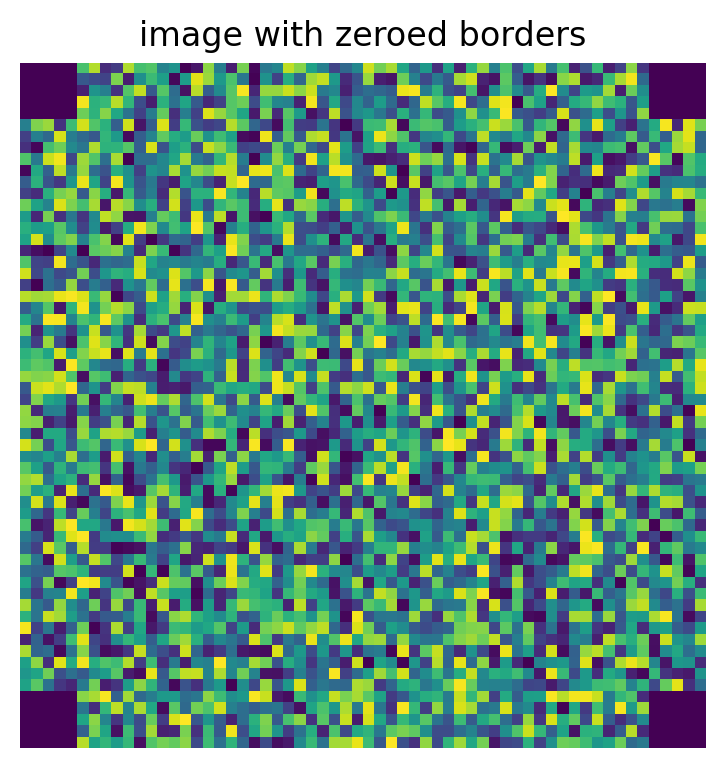
Instead of returning a boolean array, the fuction can optionally return indices into im where the border would be:
inds = ps.tools.get_border(shape=im2d.shape, thickness=5, mode='corners')
im2d[inds] = 0
fig, ax = plt.subplots(1, 1, figsize=[4, 4])
ax.axis(False)
ax.imshow(im2d)
ax.set_title('image with zeroed borders')
Text(0.5, 1.0, 'image with zeroed borders')