import matplotlib.pyplot as plt
import numpy as np

import porespy as ps
ps.visualization.set_mpl_style()
shape#
The image can be 2D or 3D. The main purpose of this little function is to generate 2D images for visualization, but 3D may also be useful for other studies.
im1 = ps.generators.conical_capillary(shape=[25, 25], r=[5, 10])
im2 = ps.generators.conical_capillary(shape=[111, 151], r=[25, 50])

fig, ax = plt.subplots(1, 2, figsize=[8, 3])
ax[0].imshow(im1)
ax[0].axis(False)
ax[1].imshow(im2)
ax[1].axis(False);

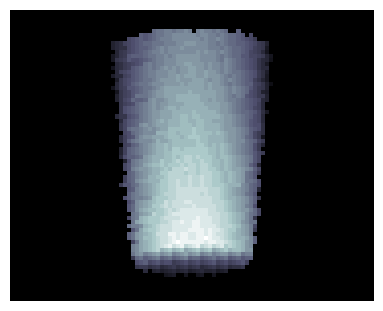
The image can be 3D. Below is a rough visualization of the cone (i.e. inverted image):
im1 = ps.generators.conical_capillary(shape=[55, 55, 55], r=[15, 20])

fig, ax = plt.subplots(figsize=[4, 4])
ax.imshow(ps.visualization.show_3D(~im1), cmap=plt.cm.bone)
ax.axis(False);
r#
This controls the radius of the left and right sides of the cone. If an int is provided then a straight tube is created. The left side can be bigger than the right as well.
im1 = ps.generators.conical_capillary(shape=[55, 55], r=[5, 20])
im2 = ps.generators.conical_capillary(shape=[55, 55], r=[20, 5])
im3 = ps.generators.conical_capillary(shape=[55, 55], r=18)

fig, ax = plt.subplots(1, 3, figsize=[12, 4])
ax[0].imshow(im1)
ax[0].axis(False)
ax[1].imshow(im2)
ax[1].axis(False)
ax[2].imshow(im3)
ax[2].axis(False);

axis#
The direction along which the cone should be oriented. The default is 0, meaning it is along the x-axis:
im1 = ps.generators.conical_capillary(shape=[55, 55], r=[5, 20], axis=0)
im2 = ps.generators.conical_capillary(shape=[55, 55], r=[20, 5], axis=1)

fig, ax = plt.subplots(1, 2, figsize=[8, 4])
ax[0].imshow(im1)
ax[0].axis(False)
ax[1].imshow(im2)
ax[1].axis(False);

Notes#
It is possible to join two images together to create a converging-diverging arrangement. Using numpy.concatenate works well as long as the orientation of the cones (i.e. axis) is the same as the axis along which the concatenation is applied:
im1 = ps.generators.conical_capillary(shape=[25, 25], r=[8, 5], axis=1)
im2 = ps.generators.conical_capillary(shape=[25, 25], r=[5, 12], axis=1)
im3 = np.concatenate((im1, im2), axis=1)

fig, ax = plt.subplots(1, figsize=[4, 4])
ax.imshow(im3)
ax.axis(False);

The same also works in 3D:
c1 = ps.generators.conical_capillary([61, 61, 31], r=[15, 5], axis=2)
c2 = ps.generators.conical_capillary([61, 61, 31], r=[5, 10], axis=2)
c = np.concatenate((c1, c2), axis=2)

fig, ax = plt.subplots(1, 2)
ax[0].imshow(ps.visualization.show_3D(c))
ax[1].imshow(ps.visualization.show_3D(~c));
