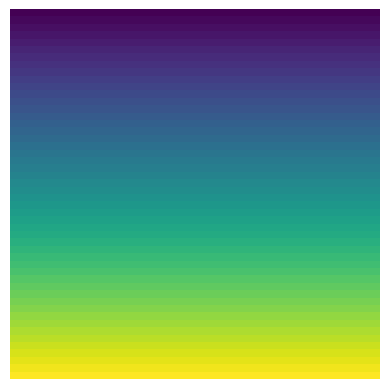
elevation#
import porespy as ps
import matplotlib.pyplot as plt
shape#
x = ps.generators.elevation(shape=[50, 50], voxel_size=1e-5)

fig, ax = plt.subplots()
ax.imshow(x)
ax.axis(False);
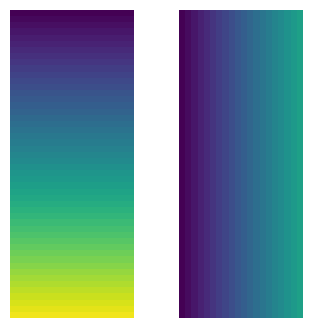
axis#
x = ps.generators.elevation(shape=[50, 20], axis=0, voxel_size=1e-5)
y = ps.generators.elevation(shape=[50, 20], axis=1, voxel_size=1e-5)

fig, ax = plt.subplots(1, 2, figsize=[4, 4])
ax[0].imshow(x)
ax[0].axis(False)
ax[1].imshow(y)
ax[1].axis(False);
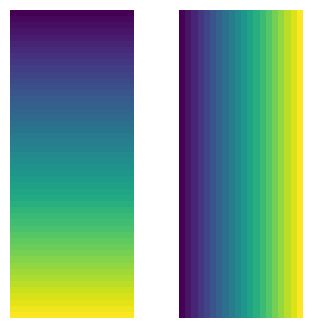
voxel_size#
x = ps.generators.elevation(shape=[50, 20], axis=0, voxel_size=1e-4)
y = ps.generators.elevation(shape=[50, 20], axis=1, voxel_size=3e-4)

fig, ax = plt.subplots(1, 2, figsize=[4, 4])
ax[0].imshow(x, vmax=5 * 1e-3)
ax[0].axis(False)
ax[1].imshow(y, vmax=10 * 1e-3)
ax[1].axis(False);